Congressional Race: DINO Data

You need to know that bit of information because it explains why someone has artificial support within the Party. Let me explain what I mean by that - there's a clique that will support a candidate that is running against anyone they hate - and they are loud and most of the time, pretty obnoxious. But they aren't really supporting the candidate that is running as much as they are trying to send a message to candidates that they dislike.
Which leads me to voter data about individual candidates and what it means.
So the local Democratic Party had some training in the Voter Activation Network or VAN for short. It has a range of uses but pretty much anyone who has any credibility uses VAN for data management and field operations. VAN is a proprietary software licensed by the Democratic Party and originated in the Howard Dean campaign.
VAN is how I am able to check the voting history of candidates that I have posted periodically. While we were at the training, the trainer went over something that is a feature of VAN called Scores. That uses several data points and an algorithm that assigns scores to each voter listed, across a range of categories. Essentially this data measures how much of a Democrat or a Republican a voter is and what is the likelihood they will vote for a Democrat on the ballot and likelihood they will defect and vote for another party down ballot.
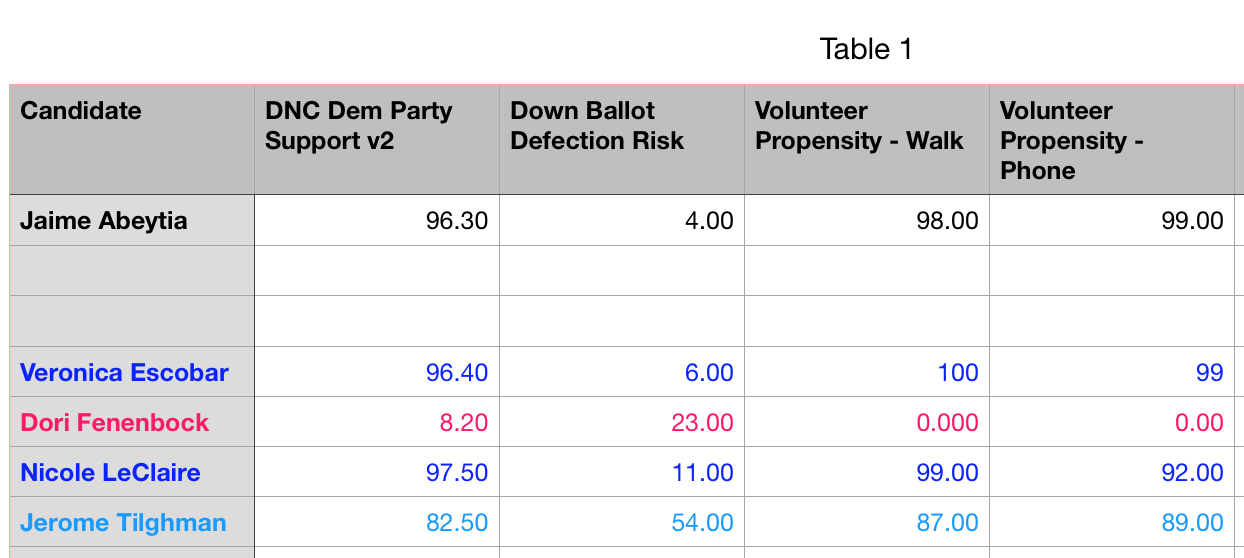
I knew what the scores meant, but since we were going over how to look up a voter at that time of the training, I asked several questions to illustrate my point to some of the folks in the room. There is one measurement called DNC Dem Party Support v2. Its based on a 100 point system. The higher the number, the more of a Democrat you are. The trainer said anyone who is belong 50 is a Republican. For context, my score is 96.30 - which is to say that there is a 96.30% chance that I am going to vote for a Democrat based on data points I mentioned earlier.
So when the trainer explained that someone under 50% was a Republican, I asked him (knowing the answer already) what someone who had a single digit score in that category meant, his response was "that person is super-Republican." He later added that "you shouldn't be talking to a voter like that if you're trying to elect a Democrat because that voter is a strong Republican voter."
There is another factor considered and it is called Down Ballot Defection Risk. It means the likelihood that you will vote for a Republican or opposite party in down ballot races on a given ballot. Again for context, my score in that area was 4.00, meaning there is only a 4% chance I'd defect to the other Party in a down ballot race.
So that voter that is "super Republican" has a Down Ballot Defection Risk score of 23.10 - meaning that there is only a 23.10% chance that the candidate would defect from the GOP and vote for a Democrat.
There is also a score that measures the likelihood that a voter would volunteer to work for a Democrat and is broken down by if you're likely to walk or make calls for a Democratic candidate. The highest score possible is 100 and I included my scores for context. Thats the index essentially of those that walk the walk, not just talk the talk.
That inspired me to compile the same data for all the candidates running for congress and I put them on this table.
The voter I was talking about that was referred to as "super Republican" based on the scores was none other than Dori Fenenbock.
For context in the chart I added my scores on VAN. I listed the candidates by alphabetical order by last name. I also color coded it, so that hard core Republicans shows up as red, hard core Democrats as dark blue and the less Democrat in lighter blue.
Many of you have been critical of my characterization of Fenenbock as a DINO, or Democrat in Name Only. Now you have data to put into context what the data says, not what I say, about the congressional candidates. Also, I have screenshots of all the data from the candidates' scores on VAN so I'm happy to share them should any of you doubt what I'm saying.
As you can see Escobar and LeClaire are the most Democratic candidates according to the data. They both have a slightly higher rating than I do in terms of voting Democratic, which I attribute to voting in Texas longer than I have voted in Texas.
Tilghman is a Democrat, but the data indicates that he's significantly more likely to defect to vote for a Republican down ballot, with a surprising 54% likelihood of that happening. This is something that Jerome has acknowledged himself on his social media recently in this post.
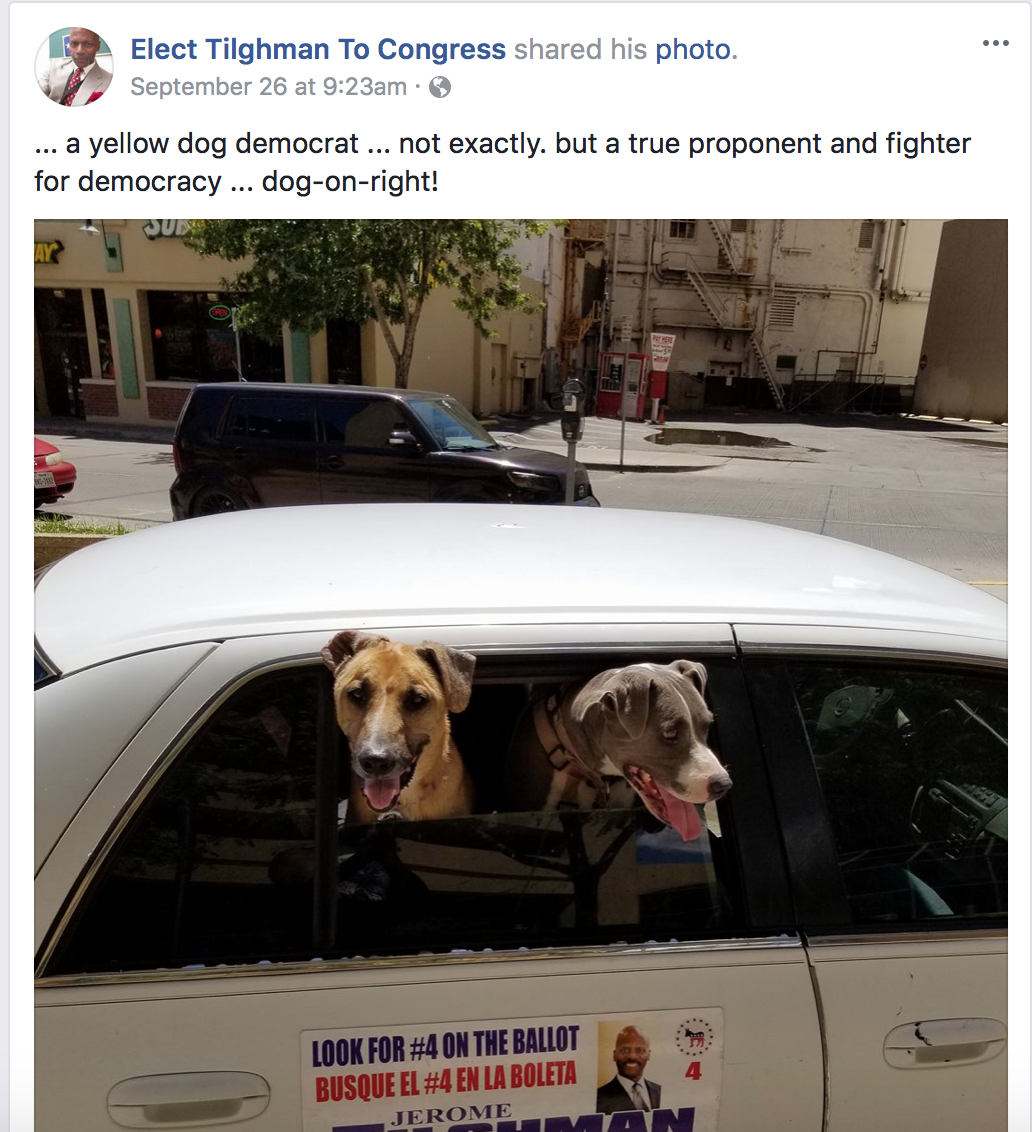
He also was a featured speaker at the very first Tea Party Rally here in El Paso and sounded pretty Republican, though he's been talking up his Democratic credentials. Although a Democrat doesn't speak at Tea Party Rallies if ya ask me. And if you recall, the Tea Party was born in response to Obama's election, so Tilghman might not want to keep that conversation going.
There is only a 23% chance that Fenenbock, were she not running for office as a Democrat, would vote for a Democrat down ballot. There is only an 11% chance LeClaire would vote for a Republican down ballot and a 6% chance that Escobar would. I came in at 4%, meaning I'm least likely to vote for a Republican down ballot. In the era of Trump...I wear that as a badge of honor.
So now you know what the data says, not just me. So for those of you that run around the Democratic Party calling yourselves Yellow-Dog Democrats, you can't call yourself that if you're supporting someone who is only 8% Democrat over candidates that are 96-97% Democrats. Or just admit that you're not voting for her because of her values, or yours for that matter, admit that you're supporting her because you don't like Escobar.
And call yourself an 8 percenter.
So think of those scores like a report card.
Escobar and LeClaire are A+ students.
At 82.5% Jerome is a B- and as for Fenenbock...at 8%
...well, Fenenbock fails.
Comments
Post a Comment
We encourage constructive community dialogue, debate, and conversation - but we reserve the right to refuse to publish a comment or delete a comment if we feel like it. Be a respectful adult. Use common sense.